Multistage Attack using protected code and Unusual CallBacks
Recently I came across a sample which remained undetected by major anti-malware solutions. The sample was a weaponized word doc file, with password protected malicious VBA macro project code. I had to struggle at some points to continue the analysis by working around the anti-analysis techniques deployed by the threat actor. The attack with this weaponized doc file is a perfect example of a multi-stage attack, whereby multiple levels of obfuscation and encrypted payloads are used to proceed with various phases.
The email headers depicts the following:
Having a look at the domain reveals that this is a join stock company based in CZK.

Strangely the originating ip address belongs to California State University:

The macro project is password protected:

We are able to see calls by the malware to the ipify free api to find out the public ip of the victim machine. Why is this done? Most probably to find out the geolocation of the victim and decide whether to run the malicious payload or not. Many malware including some ransomware originating from UKR and RUS are not executing their payloads on machines located in the respective countries.
We can see that the malware communicating to the C2 domains mindofworthboth(dot)com, fikaourherow(dot)ru and drawyourmind(dot)ru
 When the weaponized doc is opened it tricks the users to click on "Enable Editing" button and also "Enable Content", which basically executes the malicious macro

Running a dynamic analysis shows us that the word file once opens, spawns a couple of child processes and drops and executes a file called "Winhost32.exe"

Quick string analysis of the artifacts reveal the malicious domains and the URI, using which IPS signatures can be created in the network.


 We can also see some batch script like commands in the string analysis indicating use of scripts. Some APIs which are used to connect to the internet are also visible.

Some more interesting API functions

We can see some autorun registry keys added

We can also see a file "sn168.exe" being created and loaded for running the process sn168.exe

We can also see a file sn168.exe.cfg being created

We can see cmd.exe process running where it is executing a shell command where it is deleting the sn168.exe file.

Looking at process monitor's process tree we can see that the weaponized word file dropped and executed sn168.exe, which spawned another instance of sn168.exe, which dropped and spawned Winhost32.exe, which also spawned another instance of itself Winhost32.exe. We can also see the parten sn168.exe running the command to delete itself.

Since the VBA code is password protected, I tried using oletools and OfficeMalwareScanner to get hold of the VBA code but what I got was only partial code. Plus I always prefer live debugging instead of static code analysis. So, I decided to try a more "raw" method of getting hold of the VBA code. I opened up the Hex editor and opened the malicious word file in it. There I searched for signs of some VBA code and once I found something I simply messed with it. For example: replacing a Wend of a While-Wend loop with something random, so that the VBA code processing will break there while processing the word file.
I experimented with breaking the If-Then-Else-Endif clause, opened the winword.exe process in Ollydbg and passed on the path to the malicious word file as parameter to the winword.exe process. I pressed F9 to execute the code in the debugger and Voila! I am inside the broken VBA code. I can now see all of the code within forms, modules etc. Yes the threat actors used forms and "ControlTipText" property of the frame object within the form to hide the malicious text (code maybe?). Maybe that is why I was getting only partial code while trying to dump the VBA using regular tools?


I can see that the malicious text hidden in the ControlTipText property of the frame "gorse" in the form called "unsalted" is assigned to a variable called "beardown"

I can also see a module called "autarkic" and interesting code inside it.

I can see the malicious text being sent to a function called criminologist of the autarkic module, which results in some unreadable string:

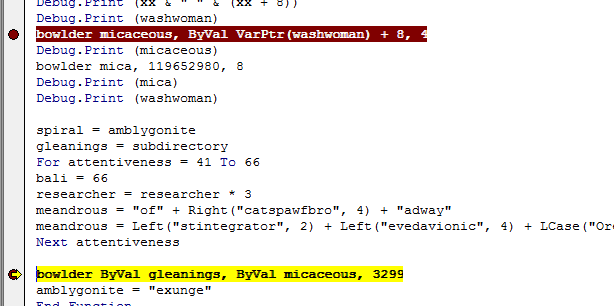
The most interesting and unusual thing I found was the declaration of Functions mapped to various Kernel32 API functions using random names like intentness, arbeit, avarus, gadfly, bowlder, lofty and noble:

This old VB concept is to declare a DLL procedure within the VB code directly and use it
Reference:https://msdn.microsoft.com/en-us/library/aa716201(v=vs.60).aspx

We can see memory allocation and manipulation done by using these direct DLL procedure calls bowlder (RtlMoveMemory):

 arbeit is for heapallocation:

We can see some #if then #else directives which are used to conditionally compile code based on 64 and 32 bit architecture:


So here is the most unusual thing about this sample. The use of gadfly (EnumSystemLanguageGroups) function. I noticed that as soon as this function is called, the dropping and spawning of sn168.exe and Winhost32.exe starts as visible in the process hacker.

I decided to have a closer look and I could see that there are 3 parameters being passed on to this gadfly function.

Looking at the MSDN about this function reveals its true purpose, which is to enumerate language groups that are either installed or supported by the OS:
What we can see is that the first parameter is a pointer to an "application defined call-back function" and the third parameter is an application-defined value to be passed on to the call-back funciton"


What does this mean? This means that the threat actor has used a previously unused and unknown method (TTechniqueP) of making a call to a malicious process hidden inside the weaponized word file, which is done using EnumSystemLanguageGroups declared originally . I tried googling any analysis of any sample whereby this has been used before but was unable to find any information liking malicious activities with this function.
I knew that for me to proceed analyzing this sample, I need to find the values of the first and the third parameter passed on to this function gadfly.
The problem is that the pointer to the call-back function (the first parameter) does not correspond to any memory location when observed in the variables and watch window of VBA debugger. This is because the code is running in the VB virtual machine (VBE7.DLL) and managed by it. The actual call is made by VBE7.DLL on behalf of the VBA code. So I need to somehow look at what is being passed on as parameters to the EnumSystemLanguageGroups API call using some other method.
From my analysis I was guessing that the malicious text from the various memory calls that the malicious text in the ControlTipText, which was xord multiple times and decrypted was of 3299 bytes in length was the malicious code. And from memory operations I could see this code being written to the memory heap.

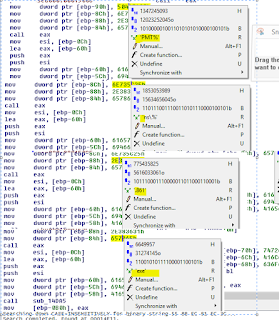
I used API Monitor to see raw API calls from the VBVM and I was able to see the following. Our EnumSystemLanguageGroups API call. The pointer 12767468 is pointing to the parameter which is the path to the weaponized word document.
Obviously when I see this API call on API monitor, then it means that the malicious code copied to process memory is already executed as the call-back function is already called and most probably removed or overwritten and I had lost control of the code flow. So this means that I have to stop before the call to gadfly (EnumSystemLanguageGroups) function and then find out what would be the first parameter (pointer to the callback function).

For this purpose I calculated the difference of bytes between the location where the malicious code is copied to 0x40205a8 (RtlMoveMemory) in the example below and the address of malicious call-back function mentioned as the first parameter in the next call to EnumSystemLaguageGroups which is 0x4020e4d in this case.
If I know this difference then I can re-run the process in Ollydbg, break in the VBA code, reach just before the gadfly (EnumSystemLanguageGroups) API call and then look at API monitor logs to search for the last RtlMoveMemory API call and look for the destination where malicious code is copied to (first parameter). Next, I will add the difference I calculated earlier to that memory location and ultimately I will find the location of the entrypoint to the malicious call-back function, which is my current objective.

The difference is 0x8a5 bytes:


Going to Olly Memory Map I can see that my target 0x9ee0e4d is located in the Heap RWE area

So I open this memory location

What do I find? A function prologue and pointer to PEB FS[30h], indicating that this is our malicious code injected all the way from the ControlTipText, decrypted, copied to process heap and called in an unusual way using EnumSystemLanguageGroups API:


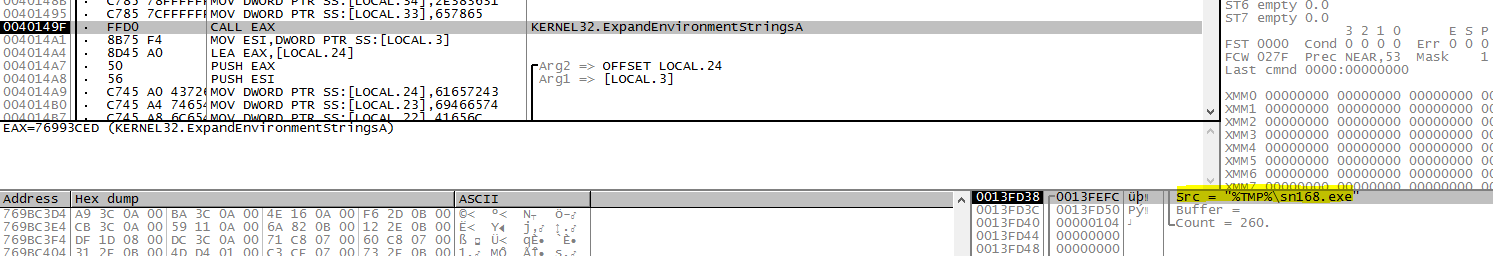
Do you remember the process tree and the sn168.exe process. We can see below hex strings are populated on the stack and used in function calls, which corresponds to %TMP%\sn168.exe, confirming that this is the malicious code we were looking for:


This could have been done to get the value for %TMP%
We can also see Createfile being called, whereby sn168.exe is opened for GENERIC_WRITE.

We also see a call to VirtualAlloc which could mean that virtual memory allocation in the process space

From this point onwards, static code analysis was not making much sense. So I decided to move to dynamic code analysis using a debugger. But first I needed to wrap the binary code in the .bin file with a regular PE file.
I used shellcode2exe python script to wrap the binary code into an exe.

I could see the binary pattern of the entry point to the malicious code in the hex editor

This exe cannot be debugged by Ollydbg because some header values needs to be adjusted, which I did by adjusting the SizeofCode and Section headers of the exe using CFF explorer. The raw address of the .text section was set to the beginning of the memory dump of the malicious code. This took me sometime as I had to experiment with different values before Ollydbg could run the code successfully.


Once Ollydbg starting debugging, I sighed a sigh of relief. Now I have more visibility and maneuverability. I locate to the entry point of the malicious call-back process and right click on the first byte and press "New Origin" so that Olly can start debugging from this point onward.

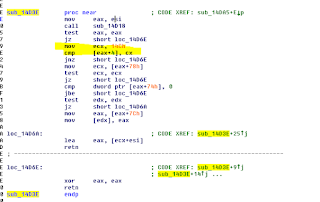
I can confirm my IDA analysis was correct as the malicious code seem to verify the MZ and PE signatures of ntdll.dll

I can see the malicious code traversing the export table of ntdll.dll


It locates the LdrLoadDll export funciton

It passes kernel32.dll to this function to load kernel32.dll


This is the piece of code which traverses the export table:

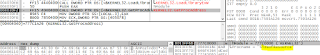
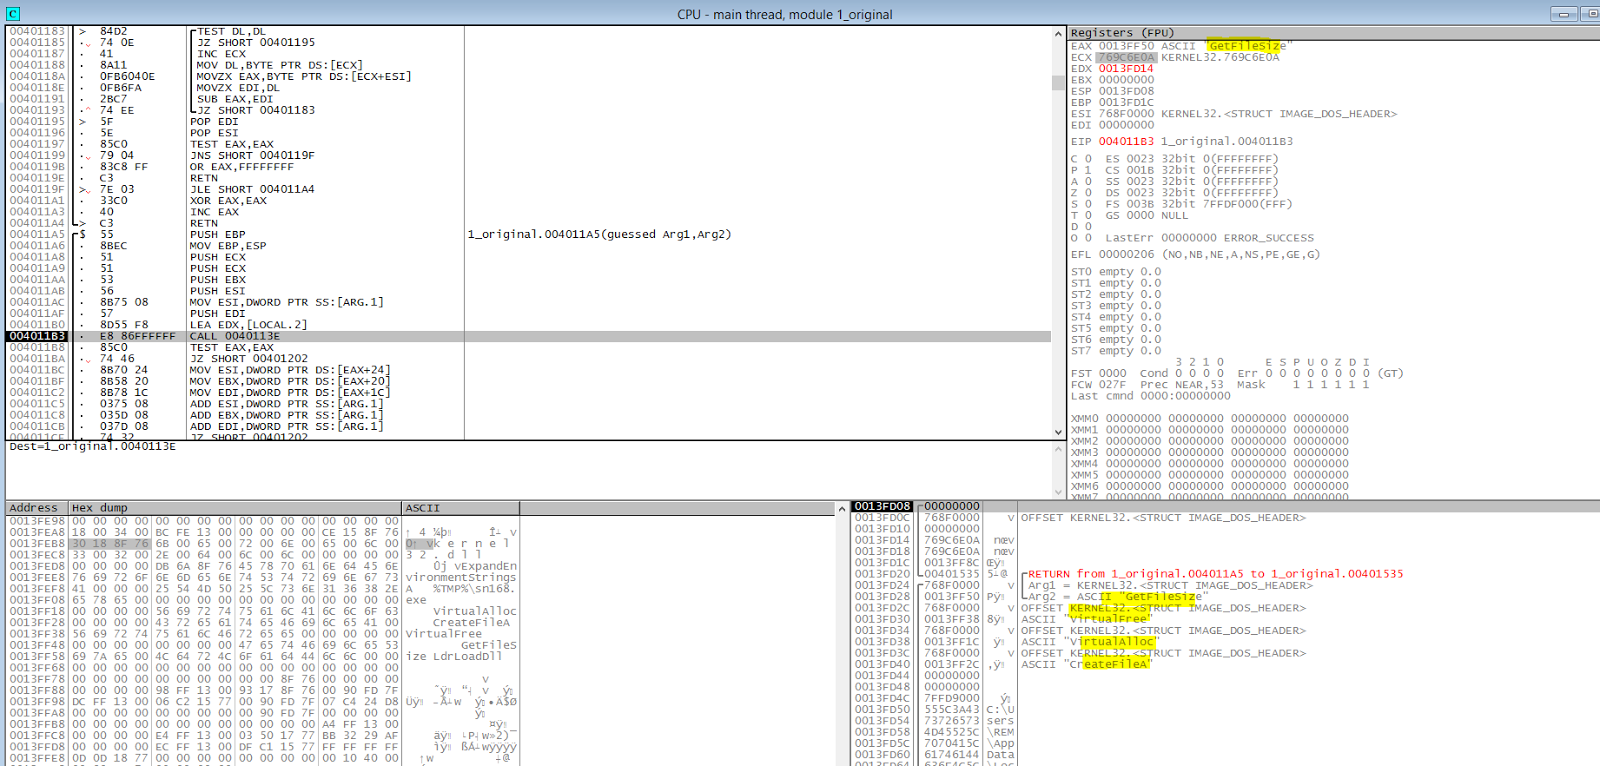
Next we see that the malicious code is traversing the export table of kernel32.dll and locating the addresses of functions like CreateFileA, VirtualAlloc, GetFileSize etc


I ran into a problem again where Ollydbg run into an exception while processing code at 0x401595, because there is no allocation on memory location [55DC469C]. But I knew that CALL DWORD PTR SS:[LOCAL.44] is actually a call to CreateFile. I remember that the third parameter of API call to EnumLanguageGroups was the path to the weaponized file, so I knew that this exception is happening because the code is looking for this third parameter.

I searched in the memory map for the path to the malicious word file "bulk_inquiry.doc" and I found it at 0x002421B0:


I simply patched the stack location for the parameter expecting filename with this memory location 0x002421B0 and the CreateFile API function which is opening the malicious word file for GENERIC_READ executes successfully:


Next I see a call to GetFileSize. Why is the malware opening the malicious word file for reading and getting its size? Most probably it is looking for some more malicious code it needs to extract/decrypt and drop on the disk and execute etc.


Next we see VirtualAlloc being called and a memory region allocated at offset 001E0000h:

We can see that the whole malicious word file is copied to the memory allocated:


Next we see a loop where the malware is searching for the offset of a byte pattern "414C4F50" (POLA) in the malicious document loaded into the memory:

We can see that the "POLA" is found and the malicious code acquires the offset starting from DB_?00[..... and starts a decryption process


After decryption completes, we can see the DOS header and MZ byte indicating a binary now located in the same location after "POLA".
We can see that these bytes are then written to %TMP%\sn168.exe


We can see the CreateProcess called to start sn168.exe

Virtual memory allocated is freed:

I opened the sn168.exe in Ollydbg to analyse what it is doing:

I can see interesting API calls specially "WriteProcessMemory"


I have noticed that this sample sn168.exe makes a lot of useless API calls in between which seemingly yields no result or factor into the malicious activities. These calls come in between the normal sequence of process injection, and maybe it is done to evade AV and other heuristic detection techniques, where AV or any other detection engine could be looking for a particular sequence of API calls to detect maliciousness. Please do let me know what do you think?

We can see that QueryPerformanceFrequency and QueryPerformanceCounter is used as anti-analysis technique to see whether there is delay in execution of IsBadCodePtr looping through the memory:


We can see below the 4060C8h is the location of the resource in the memory:

Next we see that FlushViewofFile is called, which basically is again a useless API call, which is not doing anything as the first parameter to this call is NULL:

We can see that the procadress of SizeofResource is acquired and we find out the size of the resource:

We see some memory allocation is done:

We also see that procaddress of RtlMoveMemory is acquired, which then copies the number of bytes equal to the size of the resource from the memory location of the resource to the newly allocated memory in the heap:


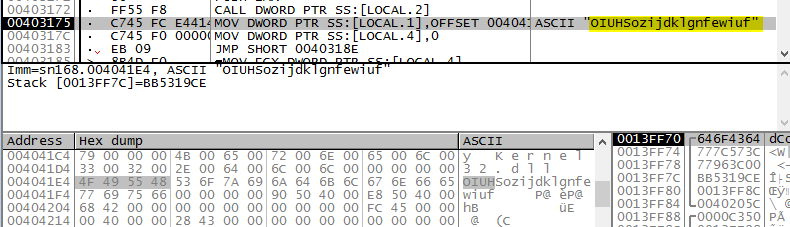
Next we see a string "OIUHSozijdklgnfewiuf", which is used in decryption of the resource

The following code is responsible for decryption

We can see the decrypted binary in the allocated memory 0x00600368:

Next we see some interesting API addresses are acquired including "NtUnmapViewofSection"

Next we see that the running module file name is acquired


Yet another weird and useless API call EraseTape:


Next we see that 44 bytes are 0'd out in the stack:

 Now we see that sn168.exe is spawning another sn168.exe process but in SUSPENDED mode:

The child sn168.exe is visible in process hacker:

Next we see unmapping of view of section from virtual address space of the child sn168.exe created in suspended mode (process id:5704 and handle 0xD8)
 Next we see API call of VirtualAllocEx (note the difference from VirtualAlloc API). This is an extended version and allows passing of process handle as a parameter in the memory space of which allocation needs to be done:
Basically the child process sn168.exe base address in memory is start of the allocation and 32768 bytes space is allocated.


Next we see a loop where 1024 bytes are written from the buffer containing our decrypted resource (next stage binary) to the child sn168.exe process memory area allocated above.


We can see all the various sections, 6 of them are written to the child sn168.exe memory space:

Then we see the usual sequence of API calls for getting, setting the threat context and ResumeThread:


After some weird operations where .cfg is concatenated to winhost32.exe and then deleting that file, we see that file Winhost32.exe in system32 directory is openend for write operation


Winhost32.exe takes a different entry path to the code as compare to the original sn168.exe and it is responsible for making calls to the C2 servers:


DNS query for hostspb(dot)com:

GET /404.php resource request, which results in the following output:

domain filkaourherow(dot)ru DNS is not resolved and drawyourmind(dot)ru is not accessible:


It seemed from the code ahead that Winhost32.exe is the backdoor, which takes instructions from C2 server and is expecting subsequent stage malware to be downloaded/received: WININET.InternetReadFile:

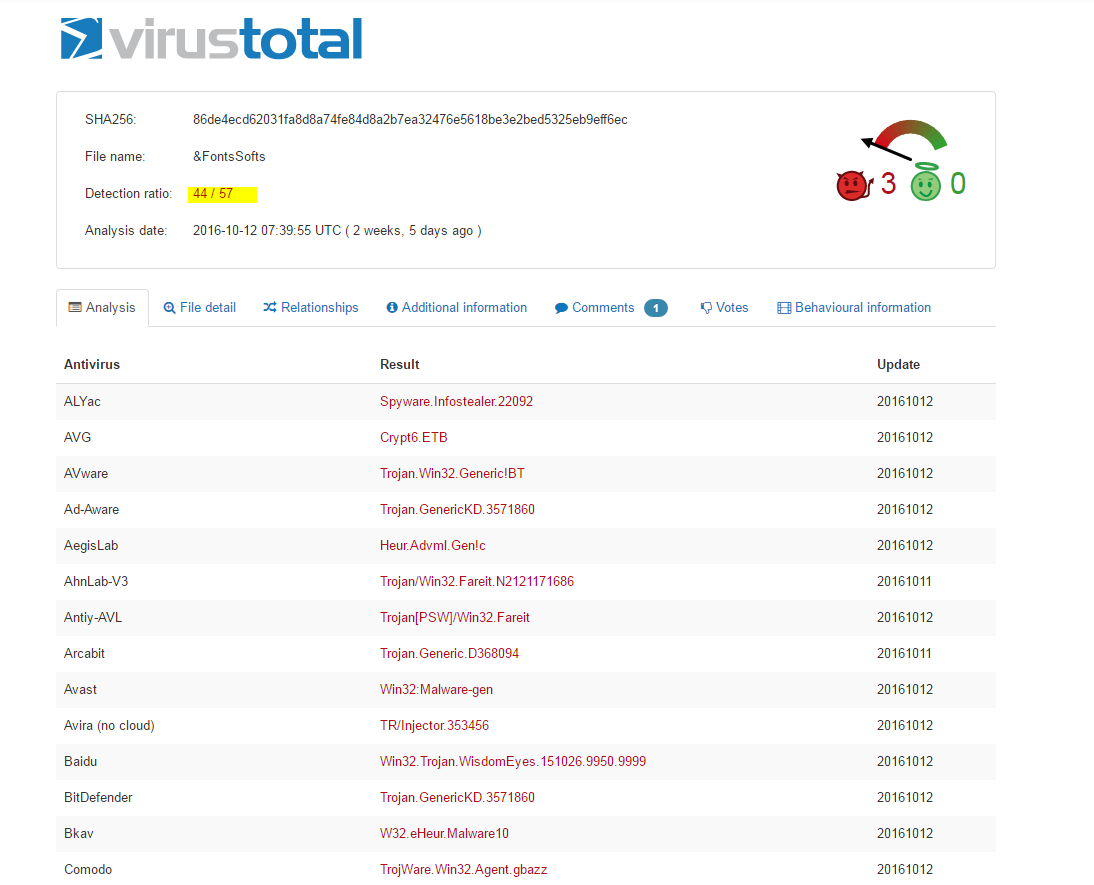
MD5 hash of sample: ede2eb4f6bc3b9ecca1d3be676674a32
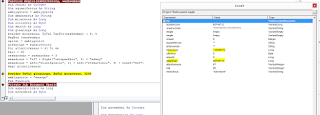
Virustotal results:


The email headers depicts the following:
Received:
from mail-ve1eur01hn0236.outbound.protection.outlook.com (HELO
EUR01-VE1-obe.outbound.protection.outlook.com)
([104.47.1.236]) by
abc.def.com with ESMTP; 03 Oct
2016 19:38:45 +0400
DKIM-Signature:
v=1; a=rsa-sha256; c=relaxed/relaxed;
d=teslablatnacz1.onmicrosoft.com;
s=selector1-teslablatna-cz01c;
h=From:Date:Subject:Message-ID:Content-Type:MIME-Version;
bh=J54M20Mquj4P7gCDDFfOLLxAOo4U7yQyYMOu31M691U=;
b=W3qj9iLM+YDfjGVEDTod0sSDtWJNMLupXEyDiFUtWPS4chwcXTGg+GLhAcf0o9jRxZp0IIqM8UcsK2IHvPC2zuus3GbuF7UcXmkcZNPFZPMqPoIpqdQthv4Nq/TLLkquxRgw+0s4sc4L3LX4crG8jUbursDLRu90Tvgyy+2NMwc=
Authentication-Results:
spf=none (sender IP is )
smtp.mailfrom=pozarek@tesla-blatna.cz;
Received:
from tesla-blatna.cz (207.62.4.129) by
HE1PR0501MB2203.eurprd05.prod.outlook.com
(10.168.33.142) with Microsoft SMTP
Server (version=TLS1_2,
cipher=TLS_ECDHE_RSA_WITH_AES_256_CBC_SHA384_P384) id
15.1.649.16; Mon, 3 Oct 2016 15:38:37 +0000
Message-ID:
<44E250B9.C8944CCC@tesla-blatna.cz>
Date: Mon, 3
Oct 2016 08:38:38 -0700
From:
"pozarek@tesla-blatna.cz" <pozarek@tesla-blatna.cz>
Having a look at the domain reveals that this is a join stock company based in CZK.

Strangely the originating ip address belongs to California State University:

The macro project is password protected:

We are able to see calls by the malware to the ipify free api to find out the public ip of the victim machine. Why is this done? Most probably to find out the geolocation of the victim and decide whether to run the malicious payload or not. Many malware including some ransomware originating from UKR and RUS are not executing their payloads on machines located in the respective countries.
We can see that the malware communicating to the C2 domains mindofworthboth(dot)com, fikaourherow(dot)ru and drawyourmind(dot)ru


Running a dynamic analysis shows us that the word file once opens, spawns a couple of child processes and drops and executes a file called "Winhost32.exe"

Quick string analysis of the artifacts reveal the malicious domains and the URI, using which IPS signatures can be created in the network.


Some more interesting API functions
We can see some autorun registry keys added
We can also see a file "sn168.exe" being created and loaded for running the process sn168.exe
We can also see a file sn168.exe.cfg being created
We can see cmd.exe process running where it is executing a shell command where it is deleting the sn168.exe file.
Looking at process monitor's process tree we can see that the weaponized word file dropped and executed sn168.exe, which spawned another instance of sn168.exe, which dropped and spawned Winhost32.exe, which also spawned another instance of itself Winhost32.exe. We can also see the parten sn168.exe running the command to delete itself.
Since the VBA code is password protected, I tried using oletools and OfficeMalwareScanner to get hold of the VBA code but what I got was only partial code. Plus I always prefer live debugging instead of static code analysis. So, I decided to try a more "raw" method of getting hold of the VBA code. I opened up the Hex editor and opened the malicious word file in it. There I searched for signs of some VBA code and once I found something I simply messed with it. For example: replacing a Wend of a While-Wend loop with something random, so that the VBA code processing will break there while processing the word file.
I experimented with breaking the If-Then-Else-Endif clause, opened the winword.exe process in Ollydbg and passed on the path to the malicious word file as parameter to the winword.exe process. I pressed F9 to execute the code in the debugger and Voila! I am inside the broken VBA code. I can now see all of the code within forms, modules etc. Yes the threat actors used forms and "ControlTipText" property of the frame object within the form to hide the malicious text (code maybe?). Maybe that is why I was getting only partial code while trying to dump the VBA using regular tools?


I can also see a module called "autarkic" and interesting code inside it.

I can see the malicious text being sent to a function called criminologist of the autarkic module, which results in some unreadable string:


This old VB concept is to declare a DLL procedure within the VB code directly and use it
Reference:https://msdn.microsoft.com/en-us/library/aa716201(v=vs.60).aspx

We can see memory allocation and manipulation done by using these direct DLL procedure calls bowlder (RtlMoveMemory):


So here is the most unusual thing about this sample. The use of gadfly (EnumSystemLanguageGroups) function. I noticed that as soon as this function is called, the dropping and spawning of sn168.exe and Winhost32.exe starts as visible in the process hacker.

I decided to have a closer look and I could see that there are 3 parameters being passed on to this gadfly function.
Looking at the MSDN about this function reveals its true purpose, which is to enumerate language groups that are either installed or supported by the OS:
What we can see is that the first parameter is a pointer to an "application defined call-back function" and the third parameter is an application-defined value to be passed on to the call-back funciton"


I knew that for me to proceed analyzing this sample, I need to find the values of the first and the third parameter passed on to this function gadfly.
The problem is that the pointer to the call-back function (the first parameter) does not correspond to any memory location when observed in the variables and watch window of VBA debugger. This is because the code is running in the VB virtual machine (VBE7.DLL) and managed by it. The actual call is made by VBE7.DLL on behalf of the VBA code. So I need to somehow look at what is being passed on as parameters to the EnumSystemLanguageGroups API call using some other method.
From my analysis I was guessing that the malicious text from the various memory calls that the malicious text in the ControlTipText, which was xord multiple times and decrypted was of 3299 bytes in length was the malicious code. And from memory operations I could see this code being written to the memory heap.
I used API Monitor to see raw API calls from the VBVM and I was able to see the following. Our EnumSystemLanguageGroups API call. The pointer 12767468 is pointing to the parameter which is the path to the weaponized word document.
Obviously when I see this API call on API monitor, then it means that the malicious code copied to process memory is already executed as the call-back function is already called and most probably removed or overwritten and I had lost control of the code flow. So this means that I have to stop before the call to gadfly (EnumSystemLanguageGroups) function and then find out what would be the first parameter (pointer to the callback function).

For this purpose I calculated the difference of bytes between the location where the malicious code is copied to 0x40205a8 (RtlMoveMemory) in the example below and the address of malicious call-back function mentioned as the first parameter in the next call to EnumSystemLaguageGroups which is 0x4020e4d in this case.
If I know this difference then I can re-run the process in Ollydbg, break in the VBA code, reach just before the gadfly (EnumSystemLanguageGroups) API call and then look at API monitor logs to search for the last RtlMoveMemory API call and look for the destination where malicious code is copied to (first parameter). Next, I will add the difference I calculated earlier to that memory location and ultimately I will find the location of the entrypoint to the malicious call-back function, which is my current objective.
The difference is 0x8a5 bytes:

I went back
to my snapshot and opened the altered word file (altered the “Wend” word in the
VBA code), which breaked at the VBA code again. I had my break points set up in
the VBA code so that the code stops before the “gadfly”
(EnumSystemLanguageGroupsW) API call. I also run the API monitor and I use the
saved filter to look for RtlMoveMemory, I can see the following:

So basically
I need to add 2213 (08a5h) to this address: 0x09ee05a8 in order to find the
location of my call-back process mentioned as the first parameter in the
EnumSystemLanguageGroupW API call. Note that this API call (gadfly) is not
executed yet. This means that once I get the memory offset for the call back
process (which is most probably the malicious decryptor and dropper code), I
can use Olly to go to that memory offset in the memory map and have a look and
even dump the memory region. When I add I get the following value:
Going to Olly Memory Map I can see that my target 0x9ee0e4d is located in the Heap RWE area

So I open this memory location

What do I find? A function prologue and pointer to PEB FS[30h], indicating that this is our malicious code injected all the way from the ControlTipText, decrypted, copied to process heap and called in an unusual way using EnumSystemLanguageGroups API:

What I do
next is that I copy all the bytes from the memory section 09EE000-09EE1FFF
(when I re-run the program it is relocated to memory area E14000-E2CFFF. I then
copy all these bytes into the Data Converter and convert the hex to raw binary
file:

I then use
IDA Pro to open the bin file and locate in the code, the entry point to the call-back
malicious process to which the path to the malicious word file “bulk_inquiry_545447.doc” is being
passed as the parameter. I looked for the entry point by searching for the
following binary pattern in IDA. I get this binary pattern from the memory location we discovered earlier.
55 8B EC 81
EC 3C 02 00 00 53 56 57 8D 45 D0 50
64 A1 30 00
00 00 8B 40 0C 8B 40 1C FF 70 08 33
DB C7 45 D0
4C 64 72 4C C7 45 D4 6F 61 64 44

Do you remember the process tree and the sn168.exe process. We can see below hex strings are populated on the stack and used in function calls, which corresponds to %TMP%\sn168.exe, confirming that this is the malicious code we were looking for:


Let us
see what is this malicious code doing:

We know that
FS[30h] is PEB (Process Execution Block). +0ch leads to PEB_LDR_DATA and +1Ch
to that leads to get the first entry in the InInitializationOrderModuleList
: _LIST_ENTRY
A LIST_ENTRY
is 8 bytes in size, so we are skipping the first entry in the _list_entry. The
next push dword ptr [eax+8] is pointer to imagebase of ntdll.dll. Next we
see string “LdrLoadDll” is moved to the
stack and a different function is called.


We see next
that the code checks whether it (ntdll.dll) has a header of MZ (4d5a) and some other checks like PE header checks etc.

Reference: http://fumalwareanalysis.blogspot.com/2011/12/malware-analysis-tutorial-8-pe-header.html
Next we see
that from the location of the MZ bytes we move 3C (60) bytes. We know that the
beginning of PE file is the DOS header (64 bytes) and the last 4 bytes of the
DOS header contains the location of the PE header. Since hex value 0x3C is
decimal value 60, we now have EAX containing the offset of PE. We also see that
file signature is checked to determine whether it contains the string “PE”.

Then it
checks whether the executable is for i386 archtecture or not:
Next we see that PE+0x78 is acquired in ecx register, which is basically the relative address of the export table of ntdll.dll:
We also see
that [eax+7ch] will give us the size of the export table.

Next we see
that the malicious code is trying to get hold of the "number of functions" in the
export table:


Next we see a
kernel32.dll string sent to stack and stored

We can see
above that the character “l” is pushed once and moved two times to stack (the
kernel32.dll).
Most probably
kernel32.dll is being loaded using LdrLoadDll and we can see one of the exported functions being
called below:

Next we can
see ExpandEnvironmentStringsA strings being pushed to stack:

This could have been done to get the value for %TMP%

We can also see Createfile being called, whereby sn168.exe is opened for GENERIC_WRITE.

We also see a call to VirtualAlloc which could mean that virtual memory allocation in the process space

From this point onwards, static code analysis was not making much sense. So I decided to move to dynamic code analysis using a debugger. But first I needed to wrap the binary code in the .bin file with a regular PE file.
I used shellcode2exe python script to wrap the binary code into an exe.

I could see the binary pattern of the entry point to the malicious code in the hex editor

This exe cannot be debugged by Ollydbg because some header values needs to be adjusted, which I did by adjusting the SizeofCode and Section headers of the exe using CFF explorer. The raw address of the .text section was set to the beginning of the memory dump of the malicious code. This took me sometime as I had to experiment with different values before Ollydbg could run the code successfully.


Once Ollydbg starting debugging, I sighed a sigh of relief. Now I have more visibility and maneuverability. I locate to the entry point of the malicious call-back process and right click on the first byte and press "New Origin" so that Olly can start debugging from this point onward.

I can confirm my IDA analysis was correct as the malicious code seem to verify the MZ and PE signatures of ntdll.dll

I can see the malicious code traversing the export table of ntdll.dll


It locates the LdrLoadDll export funciton

It passes kernel32.dll to this function to load kernel32.dll

This is the piece of code which traverses the export table:

Next we see that the malicious code is traversing the export table of kernel32.dll and locating the addresses of functions like CreateFileA, VirtualAlloc, GetFileSize etc

I ran into a problem again where Ollydbg run into an exception while processing code at 0x401595, because there is no allocation on memory location [55DC469C]. But I knew that CALL DWORD PTR SS:[LOCAL.44] is actually a call to CreateFile. I remember that the third parameter of API call to EnumLanguageGroups was the path to the weaponized file, so I knew that this exception is happening because the code is looking for this third parameter.

I searched in the memory map for the path to the malicious word file "bulk_inquiry.doc" and I found it at 0x002421B0:


I simply patched the stack location for the parameter expecting filename with this memory location 0x002421B0 and the CreateFile API function which is opening the malicious word file for GENERIC_READ executes successfully:


Next I see a call to GetFileSize. Why is the malware opening the malicious word file for reading and getting its size? Most probably it is looking for some more malicious code it needs to extract/decrypt and drop on the disk and execute etc.
Next we see VirtualAlloc being called and a memory region allocated at offset 001E0000h:

We can see that the whole malicious word file is copied to the memory allocated:

Next we see a loop where the malware is searching for the offset of a byte pattern "414C4F50" (POLA) in the malicious document loaded into the memory:

We can see that the "POLA" is found and the malicious code acquires the offset starting from DB_?00[..... and starts a decryption process


After decryption completes, we can see the DOS header and MZ byte indicating a binary now located in the same location after "POLA".
We can see that these bytes are then written to %TMP%\sn168.exe


I created a
copy because I know it deletes itself:

We can see the CreateProcess called to start sn168.exe
Virtual memory allocated is freed:

I opened the sn168.exe in Ollydbg to analyse what it is doing:

I can see interesting API calls specially "WriteProcessMemory"


I have noticed that this sample sn168.exe makes a lot of useless API calls in between which seemingly yields no result or factor into the malicious activities. These calls come in between the normal sequence of process injection, and maybe it is done to evade AV and other heuristic detection techniques, where AV or any other detection engine could be looking for a particular sequence of API calls to detect maliciousness. Please do let me know what do you think?

We can see that QueryPerformanceFrequency and QueryPerformanceCounter is used as anti-analysis technique to see whether there is delay in execution of IsBadCodePtr looping through the memory:


Queryperformancecounter
called again. Most probably as anti-debugging check (time diff between first
and second call)

We can see
the handle to self is acquired. There is a useless MoveFileExA function called
after that which returns "0" (failure). This MovefileExA is an example of a fruitless API call in between the sequence of actual malicious calls.

Then we see
that a resource of the PE is accessed:

We can see
the resource 34122 using CFF explorer. Could this be the encrypted next stage
binary, which we saw earlier dropped at the users folder? Winhost.exe?

We can see below the 4060C8h is the location of the resource in the memory:

Next we see that FlushViewofFile is called, which basically is again a useless API call, which is not doing anything as the first parameter to this call is NULL:


We see some memory allocation is done:

We also see that procaddress of RtlMoveMemory is acquired, which then copies the number of bytes equal to the size of the resource from the memory location of the resource to the newly allocated memory in the heap:


Next we see a string "OIUHSozijdklgnfewiuf", which is used in decryption of the resource
The following code is responsible for decryption

We can see the decrypted binary in the allocated memory 0x00600368:

Next we see some interesting API addresses are acquired including "NtUnmapViewofSection"

Next we see that the running module file name is acquired

Yet another weird and useless API call EraseTape:


Next we see that 44 bytes are 0'd out in the stack:


The child sn168.exe is visible in process hacker:
Next we see unmapping of view of section from virtual address space of the child sn168.exe created in suspended mode (process id:5704 and handle 0xD8)

Basically the child process sn168.exe base address in memory is start of the allocation and 32768 bytes space is allocated.


Next we see a loop where 1024 bytes are written from the buffer containing our decrypted resource (next stage binary) to the child sn168.exe process memory area allocated above.


We can see all the various sections, 6 of them are written to the child sn168.exe memory space:

Then we see the usual sequence of API calls for getting, setting the threat context and ResumeThread:


I wanted to
follow the new thread when it is resumed (the suspended process is resumed). So
I decided to take an approach using Process Hacker. I placed breakpoints right
after all WriteMemory API calls are over so that the memory section is
committed and the next stage binary is ready to run as a child sn168.exe
process.

Then I open
the process in process hacker properties of the child sn168.exe (5640 process
id). I open the memory section 0x400000 and this is where the decrypted code is
written.

I save the
file as an exe and open it in CFF explorer to find its entry point, which is 0x1e67


I then go
back to the process hacker memory section and now I want to change the 2 bytes
of entry point to an infinite loop by patching them with 0xeb 0xfe.


I click on
"Write" to commit the bytes. Note that the process is still not
thread-resumed and is in suspended mode.
Next I do an
F9 on Olly and let the parent the process run till exit process (which also
results in the child process out of suspension and into execution), and I can
feel the infinite loop working as my computer is slowing down. However I have
another Olly instance open, which I used to attach to the child process in
infinite loop. The reason Olly was not able to interpret the code was because
of our patch, it interpreted the code as data instead.

No issues, we
repatch the EB FE bytes with the original code and while being there we right
click on the code window, click on "Analyse" and then click on
"Analyse Code". This will make Olly re-analyze and then show the
assembly:

I can see the
code and I can put breakpoints on various interesting API calls

After process
enumeration, we see that the code goes through the list of running processes
trying to open them with "PROCESS_QUERY_INFORMATION" access.

Next we see
that once the handle is acquired for a process its executable image is
captured:

Then we see
that the process executable is compared with an executable called
"WinHost32.exe". Basically it is looking to see if this process
WinHost32 is running or not:

If it does
not find this process running, it seem to be creating the exe in the system32
folder
We see next
that sn168.exe is opened for read. This is the original file on disk.

Next we see
that a read operation is carried out

After some weird operations where .cfg is concatenated to winhost32.exe and then deleting that file, we see that file Winhost32.exe in system32 directory is openend for write operation

Next we see
that contents 27136 bytes are copied from sn168.exe to Winhost32.exe
Next we see
persistence mechanism being set up by adding Winhost32.exe to autorun key:

The process
winhost32.exe is created

Next we see
that the process deletes the original sn168.exe from disk:

And the child sn168.exe process exits
Let us look
at MD5 of the artifact "Winhost32.exe", We can see
that sn168.exe decrypted from weaponizsed word file by the malicious call-back function code is the
same as Winhost32.exe

Winhost32.exe takes a different entry path to the code as compare to the original sn168.exe and it is responsible for making calls to the C2 servers:

We see calls
to the api.ipify domain, using which malware is trying to find out its public
ip address
We can see
the response from the api

Which matched
with the output from whatismyip site.

We also see
the malware contacting mindofworthboth(dot)com. We can see the initial profiling information which is being relayed to the threat actors behind the C2 infrastructure, which comprise of Workstation name, username, GUID, public ip address, type=1 and windows version and 32/64 bit info. The information must be consumed by the threat actor and then the client is redirected to hostspb(dot)com.

DNS query for hostspb(dot)com:
GET /404.php resource request, which results in the following output:

domain filkaourherow(dot)ru DNS is not resolved and drawyourmind(dot)ru is not accessible:
It seemed from the code ahead that Winhost32.exe is the backdoor, which takes instructions from C2 server and is expecting subsequent stage malware to be downloaded/received: WININET.InternetReadFile:

MD5 hash of sample: ede2eb4f6bc3b9ecca1d3be676674a32
Virustotal results:


Comments
Post a Comment